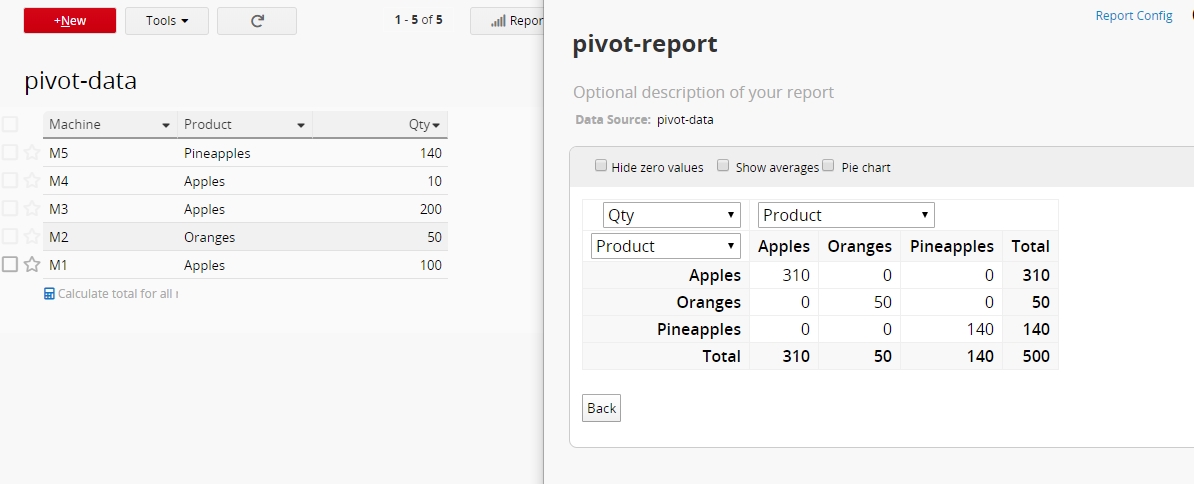
I have several machines that sometimes makes the same product.
Example:
m1: 100 apples
m2 : 50 oranges
m3: 200 apples
m4: 10 apples
m5: 140 pineapples
Is there a way to consolidate all the unique products into:
310 apples
50 oranges
140 pineapples
The grouping report does this but it is not what I need… I have to continue working with the consolidated data to assign cost and make the inventory entry.
Can you send support@ragic.com an email with the sheet link and elaborate more of this use case,
we need more information to give you appropriate advices.
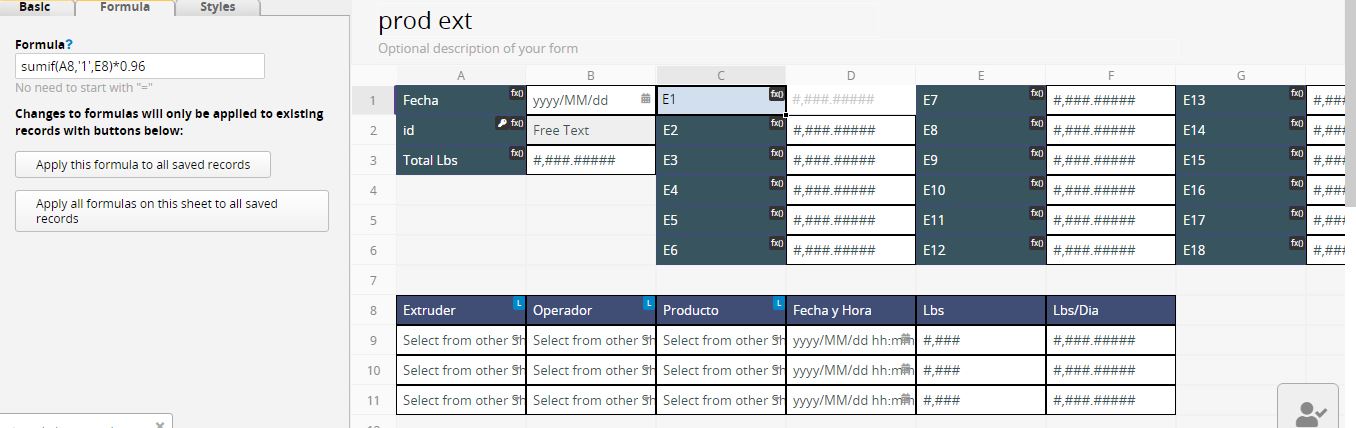
Thanks for the responses. Both the Grouping Report and the Pivot Report will consolidate (group) them. However what I need is not a report. The problem is that I need the information (in this case the group totals) within the sheet, for further calculations.
In Excel i use the pivot table to group them and then apply a price. Then total these prices daily.
By the way this is not a deal breaker for me. What I have to do is apply the price individually to every entry. Then the use the Grouping Report.
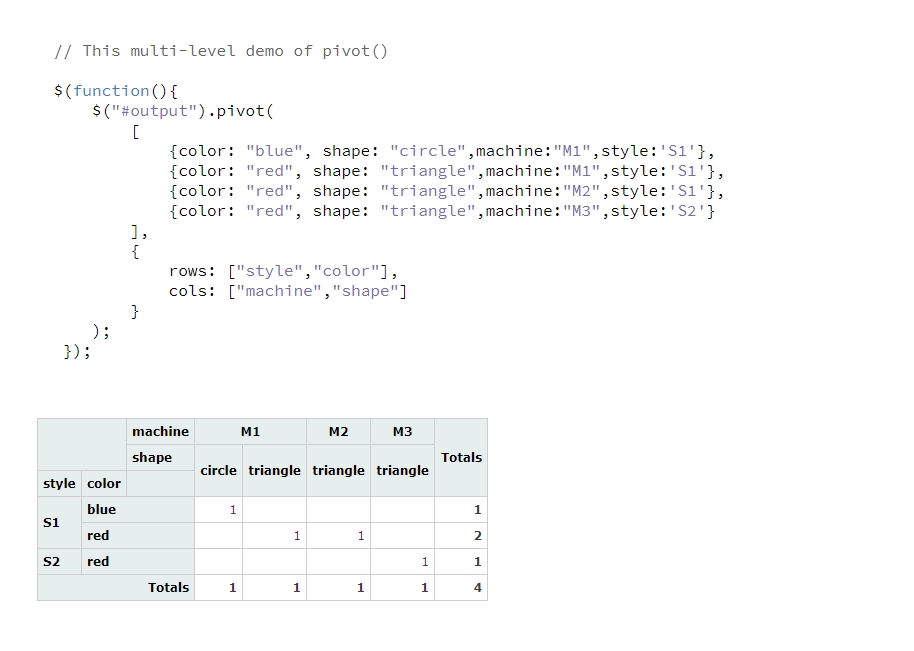
what I am hoping is to have a Pivot table where the output values can then be used in vlookup or link & load function.
same as regular excell/gsheets pivot table function.
this will greatly increase the functionality of Ragic, since we can then generate pivot tables with a unique identifier for a set of original values.
currently I need to export the data to excel, generate a pivot table, then import the table again to ragic so i have a unique value that can then be referenced.
i hope this aditional explanation helps to define the need.
best